Sales Funnel Analysis for Online Schools: What to Measure at Each Step
Sales funnel analysis is counting how many people pass each step on the way to buying your course, split by where they came from, and then finding the step that loses the most buyers you could realistically keep. For an online school the steps are few: a visit to the page, a lead (an email left in a form), an order (a click on the buy button), and a payment. You compare each step with the one before it, for the same group of people, and against your own earlier months.
Three habits matter more than the software: tag every link, follow one group of people through the steps instead of adding up a month's totals, and wait long enough before you judge a source.
One example runs through the article. Say you teach chess and sell Openings That Hold, a $69 video course for club players. The lead magnet is a one-page cheat sheet with a ten-move repertoire, followed by three emails; the third one makes the offer. Visitors come from your YouTube channel and from Meta ads at $0.40 a visit. All the numbers are made up for the walkthrough, not benchmarks.
What to measure at each step
| Step | What you count | The rate to watch | What to check when it drops |
|---|---|---|---|
| Visit | People who reached the page, by source | The ad or video promises something the page doesn't | |
| Lead | Form submissions with an email | Visit to lead | Too many fields, a slow page on phones, an unclear freebie |
| Warm-up | How many leads got each email, and clicks | Clicks on the offer link | Emails in spam, an offer that comes too late |
| Order | Orders created: someone clicked buy and gave an email | Lead to order | The offer email, the price, the course page |
| Payment | Paid orders and revenue | Order to payment | Card declines, currency, a checkout that is awkward on a phone |
| After | Refunds and repeat payments | Refund rate | A course that doesn't match the promise |
Two more numbers sit beside the steps. Ad spend per source turns rates into money: cost per lead, cost per buyer, and return on ad spend (revenue divided by spend). And the time from lead to payment tells you how long to wait before counting.
Treat email opens as a weak signal. Some mail apps load the tracking image on their own, so an "open" can happen without a person reading anything. Clicks on the offer link and orders tell you more.
A sales funnel analysis of one month
Here are the September visitors of the chess course, followed until October 31, so that people who decided slowly still count.
| Source | Visits | Leads | Orders | Paid | Revenue | Ad spend |
|---|---|---|---|---|---|---|
| YouTube | 2,000 | 240 | 14 | 10 | $690 | $0 |
| Meta ads | 1,500 | 120 | 9 | 6 | $414 | $600 |
| No tags | 500 | 40 | 3 | 2 | $138 | $0 |
| Total | 4,000 | 400 | 26 | 18 | $1,242 | $600 |
Read it step by step. Overall, 10% of visits become leads: 12% from YouTube, 8% from ads. 6.5% of leads place an order, and 69% of orders get paid (18 of 26). From lead to payment the course converts 4.5%.
The money hides the first trap. Spread over all buyers, $600 of ads bought 18 sales: $33 per buyer on a $69 course, and the month returned 2.07 times the spend. That looks healthy. Split by source, the ads brought 6 buyers, so each cost $100, and the $414 they paid covers 0.69 of the spend. The ads lost $186 on the first purchase. The blended number hid it, because YouTube buyers cost nothing in ads. Divide each source's spend by that source's buyers, never by the total.
The other thing the table shows: 8 people clicked buy and didn't pay. At $69 that's $552, close to half of the month's revenue, from people who had already decided.
Count the same people through every step
The easy report divides this month's payments by this month's leads. It mixes people. Suppose that in October you email a launch to your whole list. New leads that month: 380. Payments: 41. The easy report says 10.8% of leads bought. But 24 of those payments came from people who joined the list before October. The October leads produced 17 payments, which is 4.5%, the same as September. Read 10.8% as the new normal and you'll buy ads expecting a rate they can't reach.
So take a group (everyone who first visited in September, say) and follow only them: how many left an email, ordered, paid. That's a cohort, and every rate in the table above is one.
A cohort needs time. If half your buyers pay within 4 days of leaving an email and a few take three weeks, someone who signed up on September 29 hasn't had a chance by September 30. In the example, the September group showed 14 payments on September 30 (9 from YouTube, 4 from ads, 1 untagged). Four more arrived in October, two of them from ad leads. Judged on September 30, the ads cost $150 per buyer. A month later, $100.
We'd judge a month's leads about three weeks after the month ends. The cost is slower decisions: during a launch you can't wait that long, so watch the daily numbers then and do the honest count afterwards.
Which source gets the sale
Attribution is the rule that decides which source a sale belongs to when a person touched several. Say Sam finds the cheat sheet through a YouTube video and fills in the form. A week later a Meta ad for a free live Q&A catches him and he registers again. Two days after that he buys.
- First touch gives the $69 to YouTube: it found him.
- Last touch gives it to the ad: it was the last thing before the payment.
- Linear splits it: $34.50 each.
First touch answers "where do new students come from", the question behind a budget for cold traffic. Last touch answers "what pushed people to pay", the claim a retargeting campaign makes. We'd keep first touch as the default and look at last touch when you're deciding whether a retargeting campaign earns its money. Don't switch models from month to month: the rates stop being comparable.
Sales funnel tracking starts with tags
None of the above works if sources are guessed. A UTM tag is a label added to a link (?utm_source=youtube&utm_medium=video&utm_campaign=repertoire) that analytics tools read on arrival. Agree on the values before the first campaign and write them down:
utm_source: where the link sits (youtube, facebook, newsletter, a partner's name).utm_medium: the kind of traffic (video, cpc, email).utm_campaign: the campaign name or the ad platform's campaign ID.
Lowercase everything. "Facebook" and "facebook" become two rows, and nobody adds them up later. Tag the links in video descriptions, your profile, partner posts and ads.
Search, typed addresses and forgotten links arrive without tags: 500 of 4,000 visits in the example. If the untagged row becomes the biggest one, comparing sources stops meaning much.
Which step to fix first
Put your own month into the calculator. It shows what one more point at each step is worth.
Example values for the $69 chess course (change them to your own).
| Step | Example | Result |
|---|---|---|
| Visitors per month | 4,000 | |
| Visitor to lead | 10% | 400 leads |
| Lead to buyer | 4.5% | 18 buyers |
| Price | $69 | $1,242 revenue, about $0.31 per visitor |
| Visitors +10% (4,400) | 19.8 buyers, about $1,366 (+$124.20) | |
| +1 point visitor to lead (11%) | 19.8 buyers, about $1,366 (+$124.20) | |
| +1 point lead to buyer (5.5%) | 22 buyers, $1,518 (+$276) | |
| Target: $2,000 a month | 29 sales, 645 leads, 6,445 visitors |
One more point from lead to buyer adds $276 a month. Ten percent more visitors adds about $124, and if those 400 visits come from ads at $0.40, they cost $160: you'd pay more than they bring. So the order of work for the chess course is:
- Checkout first. Eight unpaid orders in a month is the cheapest leak to close. Buy the course yourself on a phone, with a card from another country if you sell abroad, and write to the people who left an order unpaid.
- Then the offer email. Check how many leads clicked its link. If few did, it's one text you can rewrite this week.
- The page later. A visit-to-lead rate of 10% isn't the weak spot here, and a new page takes longer to build and test.
Your own month may point elsewhere. If you're still building the steps themselves, start with the course sales funnel walkthrough; if the page is the weak step, the landing page guide goes through it block by block.
When the numbers mislead
- Small groups. The ads brought 6 buyers. One sale more or less moves their cost per buyer from $100 to $86 or $120. Below a few dozen conversions at a step, wait for more data before you rewrite anything.
- Two changes at once. A new price and a new email in the same week leave you guessing which one moved the rate.
- A launch month next to an ordinary month. Compare launch with launch.
- Other people's benchmarks. A conversion rate from someone else's school mixes a different price, audience and offer. Compare with your own last month.
- Cookie banners. Analytics that waits for consent doesn't count visitors who decline, so visit counts run low and differ between tools. Trust trends within one tool more than the absolute numbers across two.
- Refunds. Revenue in the month of sale doesn't know about refunds that come later. Check them before you call a source profitable.
How to set this up in Scholaxy
In Scholaxy, sales funnel analytics live on a few screens, one or two for each step. Nothing needs to be installed: the counters on pages you publish in Scholaxy run by themselves.
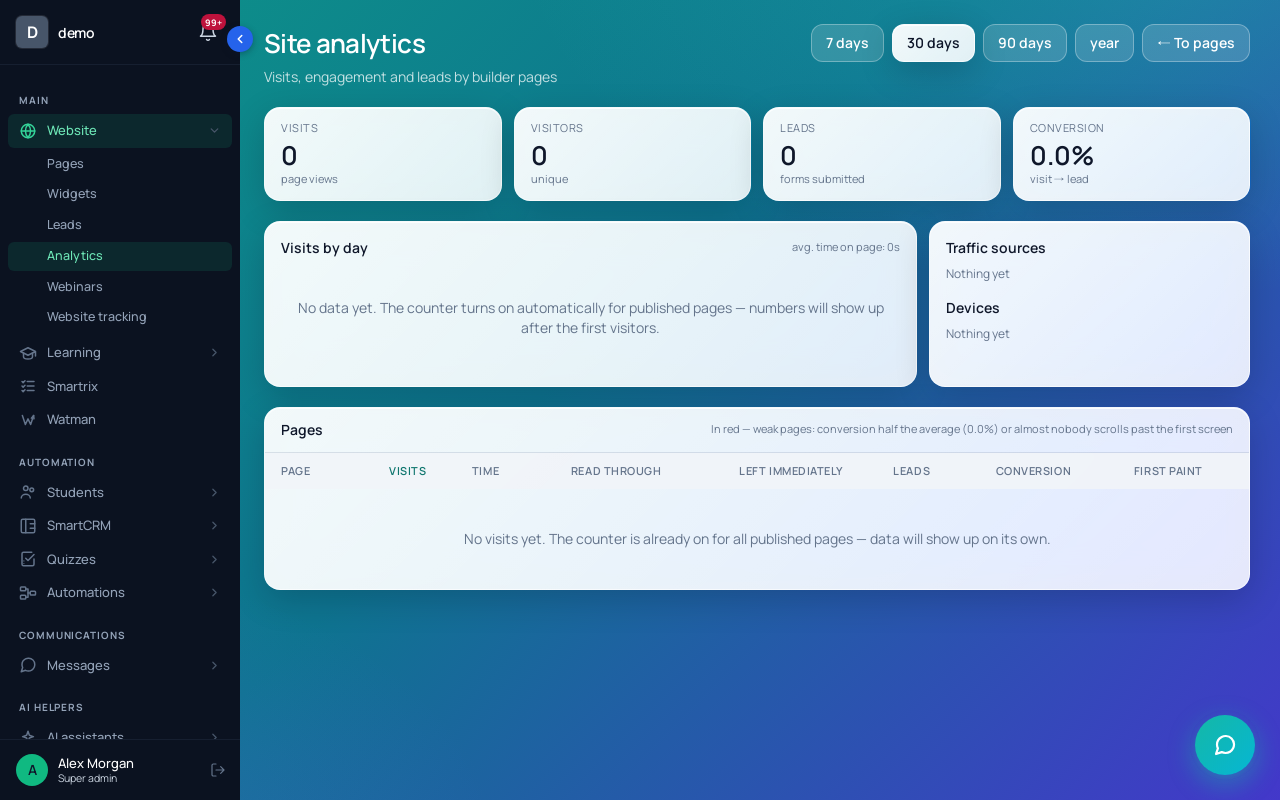
Visits and leads per page. "Website" → "Analytics" shows visits, leads and "Conversion" for every published page. It counts visitors who clicked "Accept" on the cookie notice, and it skips anyone signed in to the school (you, your team, students), so your own checks don't inflate the numbers. Sort the "Pages" table by "Conversion": rows in red are weak pages. Open one to see "How far they read" (the block where people stop) and the "Click map". The exact number of leads is always in "Website" → "Leads".
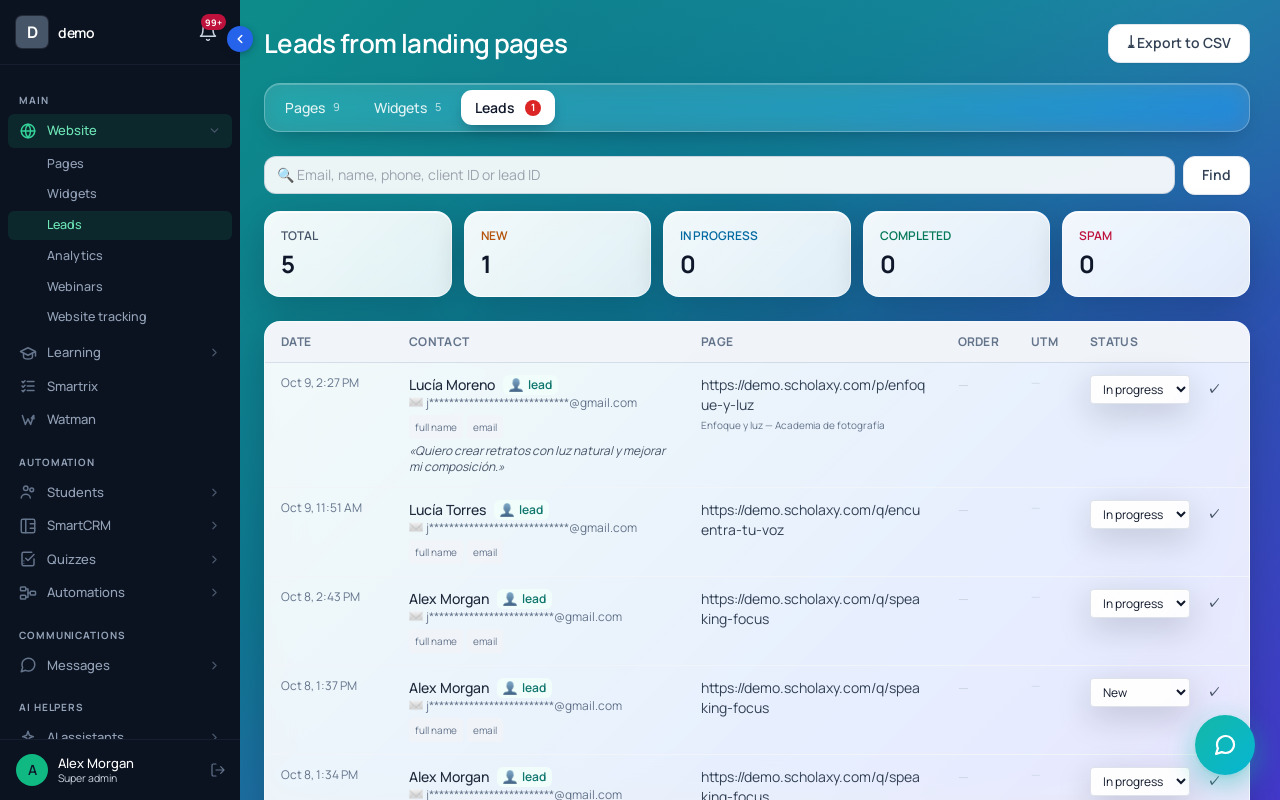
Tags on leads. Every lead stores the UTM tags of the link the person came from. Open a fresh lead in "Website" → "Leads" and check that the tags are there. For a form that people reach without tags, fill in "📊 Default UTM tags" on its "After submitting" tab; tags in the link take priority. And make Email a required field: a form submission creates the person's account only when there is a valid email, and the step-by-step funnel below follows people by account.
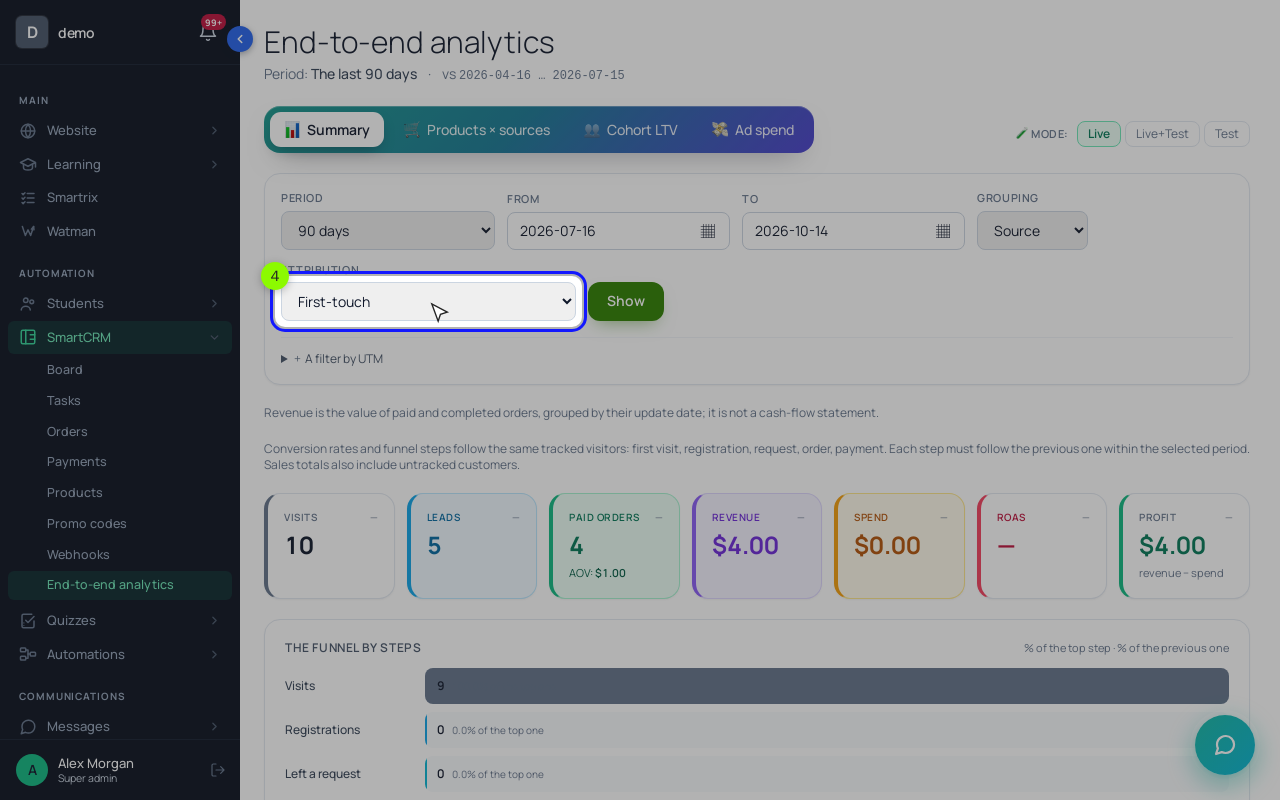
The whole path. "SmartCRM" → "End-to-end analytics" puts visits, leads, "Paid orders", revenue and ad spend side by side, split by tag. Its "The funnel by steps" goes Visits → Registrations → Left a request → The 1st order → The 1st payment → A repeat payment, and it is a cohort: it follows people whose first visit falls inside the period, and each step has to happen before the period ends. That's why the last days of any period look short. We'd read 90 days for rates and compare periods of the same length. Set "Grouping" to "Source" or "Campaign"; clicking a value opens the leads and orders with that tag, so you can see who ordered and didn't pay.
"Attribution" offers "First-touch" (the default), "Last-touch", linear, "U-shape (40/20/40)" and time-decay. The touches are the person's first tags plus the tags of every form they sent before paying; a visit without a form isn't a touch. "The time from a lead to a payment" shows the median for the period, which is your waiting time from the cohort section. Ad spend comes from Meta Ads or Google Ads ("Admin panel" → "Integrations", up to 32 days per import, repeated by you) or by hand and CSV on the "💸 Ad spend" tab. Keep the ad account in the school's currency: spend isn't converted. Revenue comes from paid orders, dated by the day of payment.
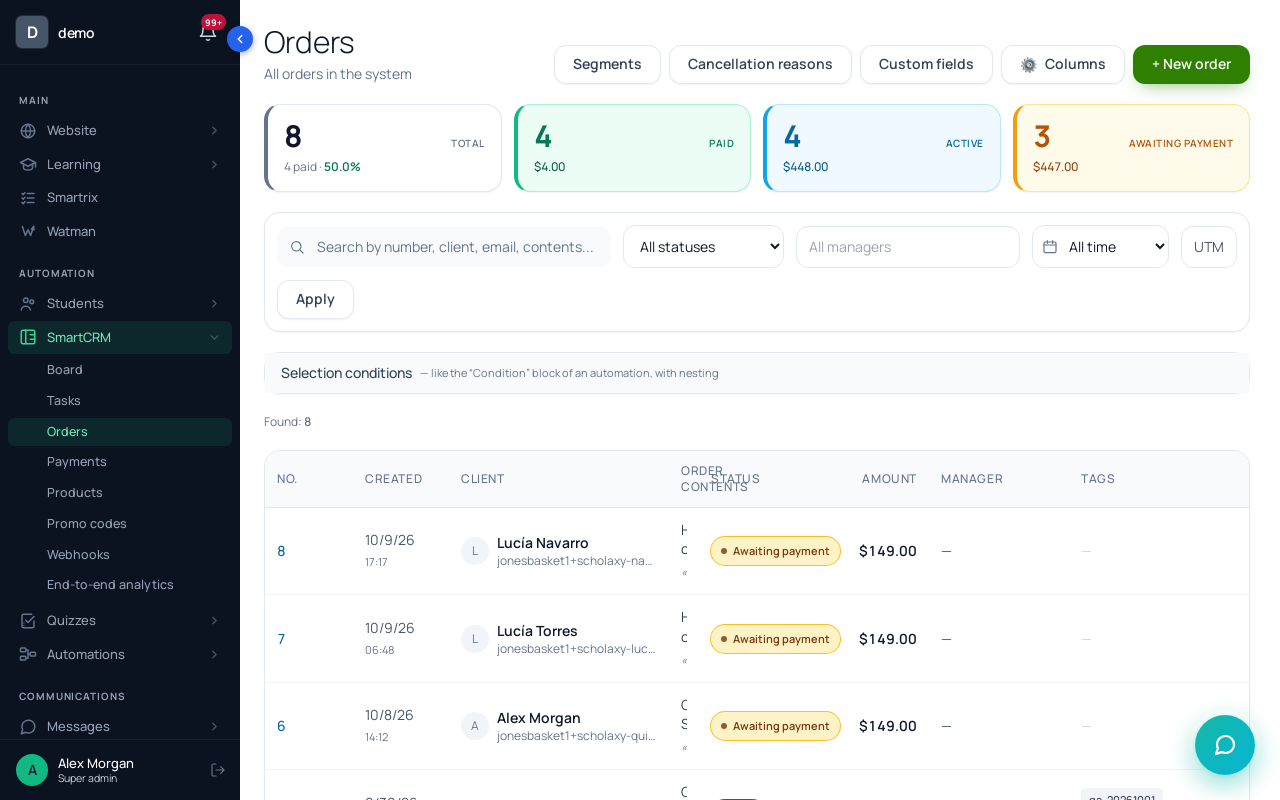
Unpaid orders. A buy button on a Scholaxy page creates the order with "Awaiting payment" before the person pays, so the step from order to payment is visible. In "SmartCRM" → "Orders" filter by status, period and UTM. Open an unpaid order and send the payment link with "📋 Copy the link" if you write to the person.
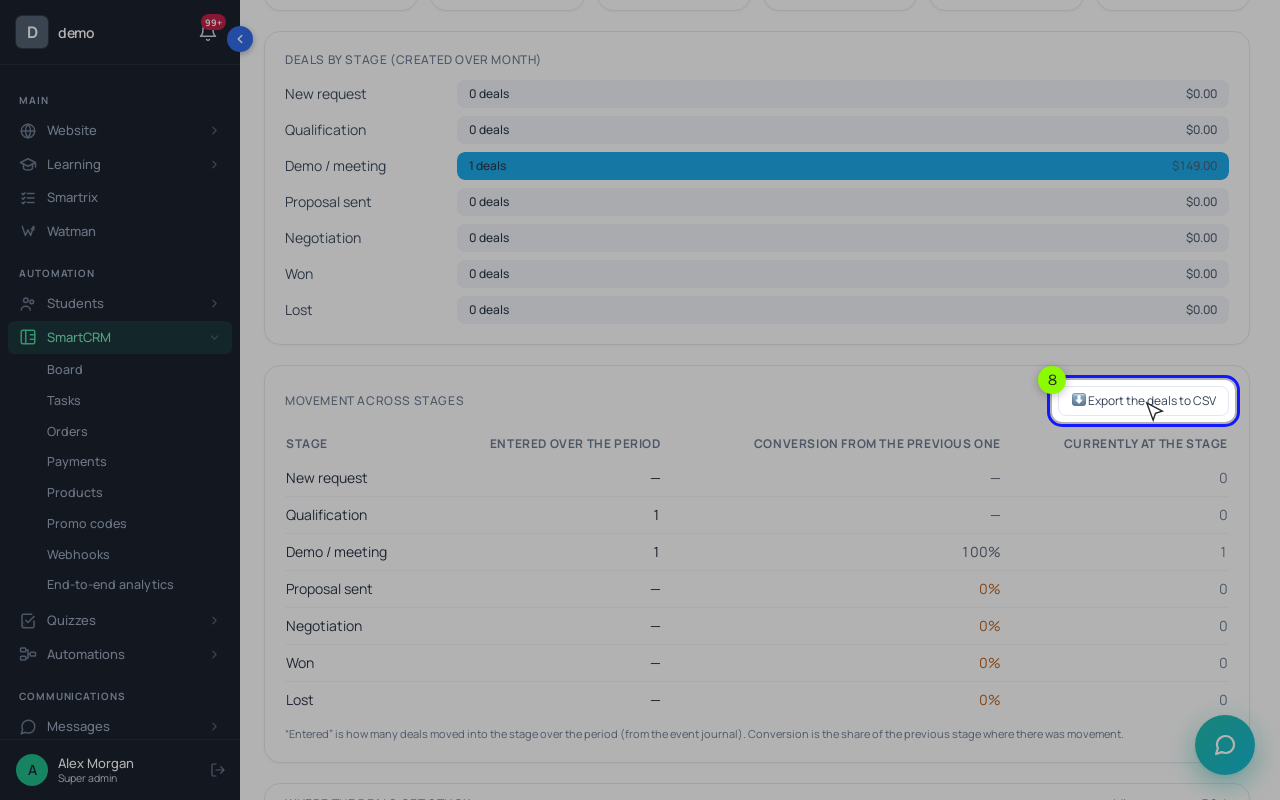
Deals, if you sell through calls. On the "Board", the chart icon opens the "Funnel report": "Movement across stages" with "Entered over the period" and "Conversion from the previous one", "Where the deals get stuck" and "Refusal reasons" (fill the board's "Closing reasons" list first). Moves count only since the journal behind the report appeared, so a new board needs a few days of work before the stage rates mean anything. Setting up the stages themselves is in CRM automation.
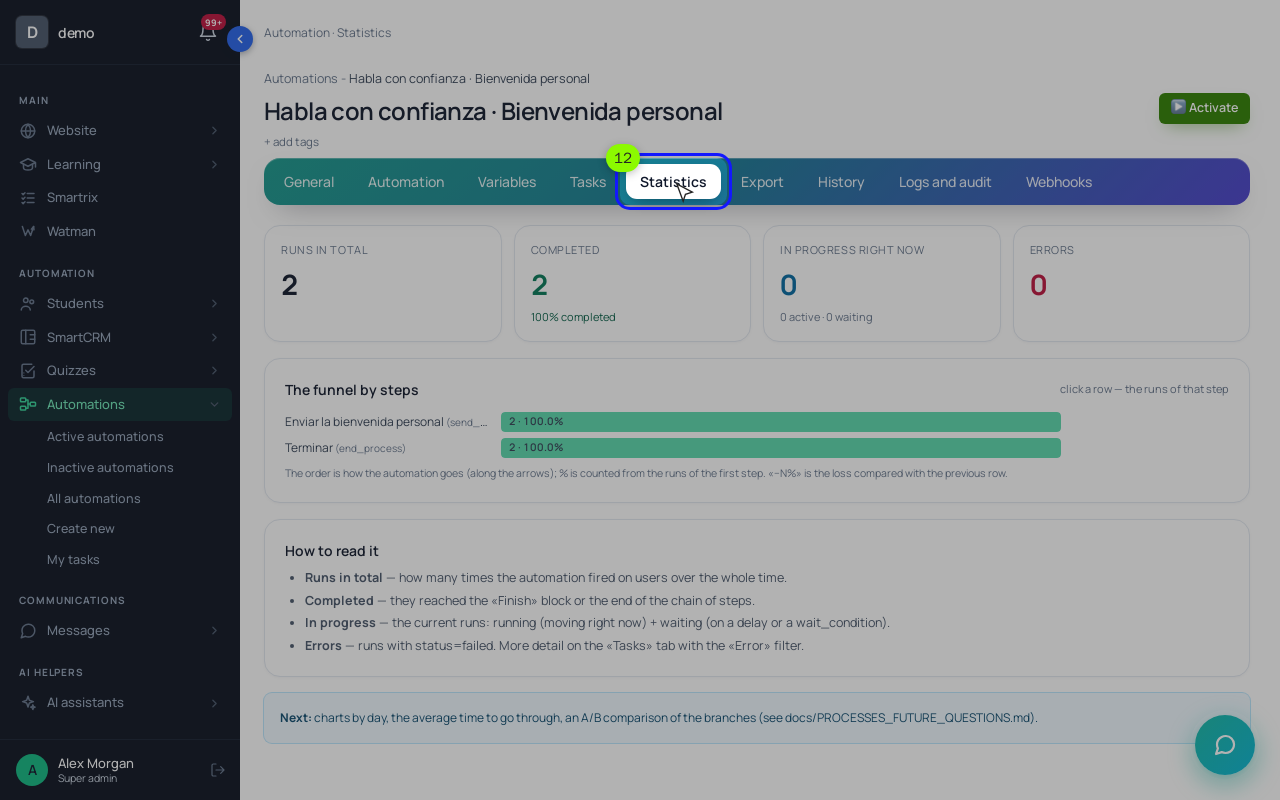
The warm-up emails. A process's "Statistics" tab has "The funnel by steps": how many runs reached each block and the loss compared with the previous one. It shows whether leads reach the offer email at all. A one-off broadcast shows "Delivered", "Opened" and "Clicks" on its card.
Your first funnel review
- Write down your UTM values (source, medium, campaign), all lowercase, and tag every link you control.
- Make Email required on every lead form.
- Buy your own course on a phone and finish the payment.
- Import or enter the ad spend for the month.
- Three weeks after the month ends, fill in one row per source: visits, leads, orders, paid orders, revenue, spend.
- Compute the rate at each step and the cost per buyer for each paid source.
- Pick the one step with the biggest loss that is cheapest to fix. Change one thing there and check the same table a month later.